The year 2024 is a stock market election year, prompting investors to wonder about its impact on their portfolios. Just the act of wondering about that impact shows that it is already having a psychological effect on us, which can lead to an impact on the markets. After all, we all can become more sensitive to news and developments related to politics, which has the potential to lead to increased speculation and thus, increased volatility.
We believe many investors would agree that politics has an influence on the economy and the investing landscape, but how predictable is that influence? And what actionable steps can we take based on the patterns of history?
In this analysis, we’ll delve into the historical performance of the stock market during election years, debunk common myths, and provide other key principles to be aware of to make informed investment decisions regardless of the political landscape.
This article is broken into 3 main sections:
- Understanding Market Dynamics
- Presidential Election Stock Market Impact
- Should Politics Influence Investment Strategy?
Understanding Market Dynamics
First, it’s crucial to acknowledge that market outcomes can vary widely year-to-year, regardless of whether it is an election year or not. While short-term market movements are unpredictable, long-term investment horizons have historically offered more stability and less downside.
The chart below illustrates this point.
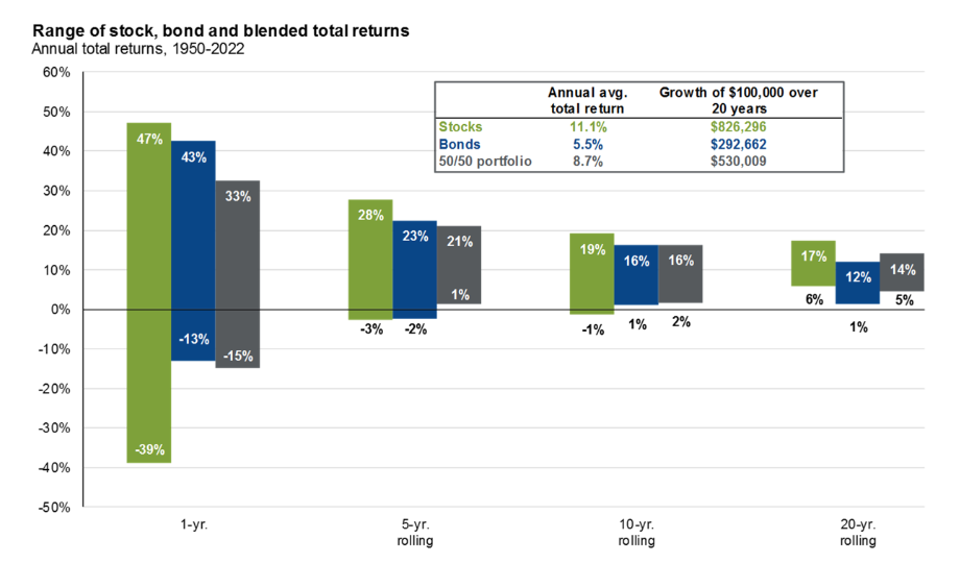
- The Green Bars show the range of returns of Stocks only during various rolling timeframes.
- The Blue Bars show the range of returns of Bonds only during various rolling timeframes.
- The Gray Bars show the range of returns of a 50/50 split between stocks and bonds during various rolling timeframes.
As you can see, the longer the rolling period, the less downside volatility exists.
Presidential Election Stock Market Impact
The combination of the terms “election” and “stock market” can trigger anxiety among investors. The fear of volatility driven by political uncertainty is common. But does the data support this concern?
Contrary to the fear and uncertainty that we may feel, the stock market has historically outperformed during election years. From 1928 to 2020, the S&P 500 returned an average of 11.58% in presidential election years, outperforming the overall average annual performance which is closer to 10% during that period . This historical trend suggests that election years might not be as detrimental to investments as some may think.
The Role of Political Parties
Since 1928, there have been 24 presidential elections, 15 presidents, 7 of which were Republican, and 8 of which were Democrat.
Election Year Stock Market Performance
The chart below shows us the total returns of the S&P500 in the year that each President was elected since the year 1928.
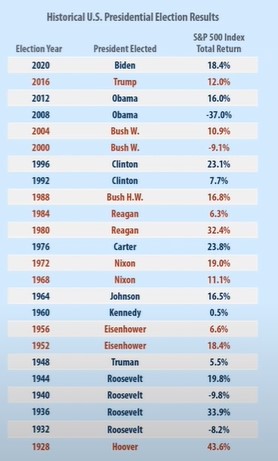
The average S&P 500 return for Republican presidents in the year that they were elected was 15.2% positive.
The average S&P 500 return for Democratic presidents in the year that they were elected was 8.4% positive.
But does this tell the full story?
Remember, the year of the election, that specific president hasn’t had time to put in place their policies yet, so the performance in that year is more about the market’s perception of how they are going to impact the economy as opposed to the actual policy impact. The following years should inform us as well.
First Year of the Presidency
The chart below shows us the total returns of the S&P500 in the first year of a four year presidential term since the year 1977.
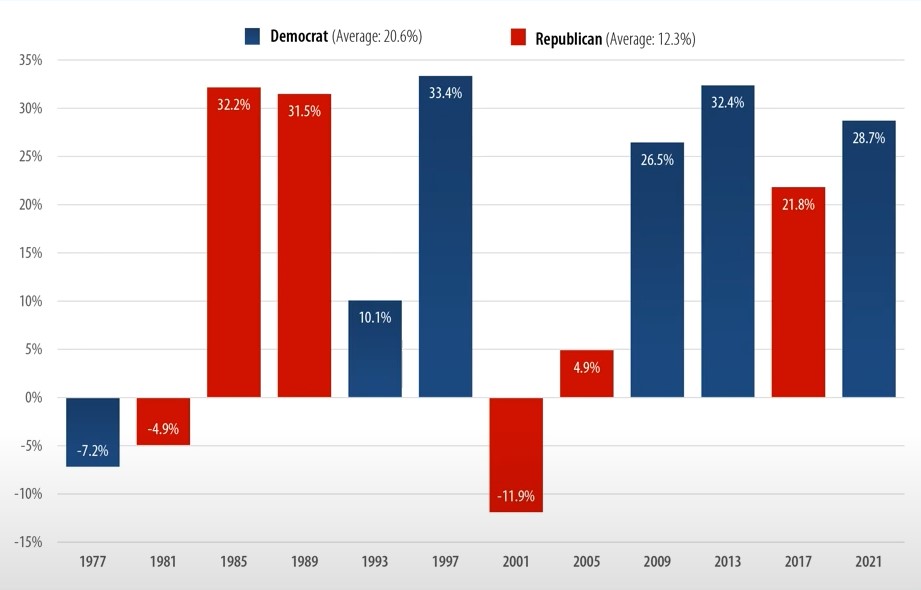
So since 1977, the S&P500 has an average of 20.6% positive returns under a democratic president’s first year of their presidency, while the average was 12.3% positive returns under a republican president’s first year of their presidency.
This provides an interesting dynamic: Based on our analysis so far, the recent trends suggest that election years favor a Republican Presidential Elect, whereas the first year of the presidency favors a Democratic President Elect.
But this still doesn’t tell us the full story, because now we’ve only looked at election years and the first years of each President’s term. What about the rest of their terms?
This chart below shows the Compound Annual growth rate under Republican Presidents and Democratic Presidents since 1957 which includes their entire terms.
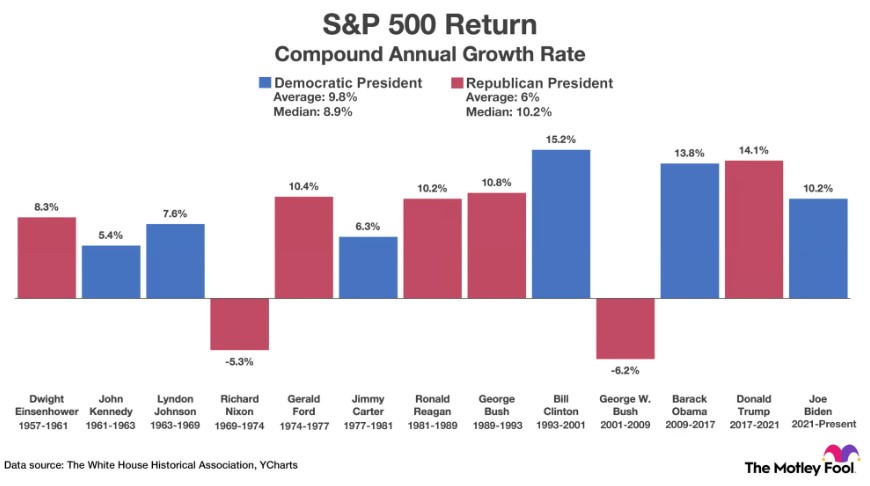
Since 1957, the average for the entire terms under each president favors Democratic Presidents with an average S&P500 annual growth rate of 9.8% while the Republican Presidents during that timeframe have an average of 6%.
However, the Median number is higher under Republican Presidents. (Median is usually used when trying to remove outlier numbers that may skew the statistics one way or the other).
This is why you’ll often hear both parties make the claim that the market and the economy are better under their watch. But continue reading into this next section to learn why this is mostly political rhetoric.
Should Politics Influence Investment Strategy?

The presidency, while significant, is just one of many factors influencing market performance. While it is tempting to adjust investment strategies during election years, it’s essential to recognize the multitude of other variables at play.
We can analyze the historical performance during election years, and we can even examine individual economic policies of each president. But even if we could do that at a high level, that would still be an insufficient analysis to determine any definitive outcomes for investment expectations.
Other major variables at play are war vs peace, trade dynamics, demographics, technological advancements, corporate earnings, debts and deficits, inflation rates, interest rates, unemployment rates, the direction of any of the above, as well as the change of pace of any of the above.
Any one of those variables I mentioned can be drilled down into further subcategories as well which makes it even more complicated. Politics is just one of the important categories, and an election in one country is a subcategory within that category.
Any one of those variables can be a major headwind while another is a major tailwind, and it’s incredibly difficult to know which wind will overblow the other. And altogether, it’s like a hurricane. Trying to predict how the wind will feel in one exact spot at one exact moment is virtually impossible. And that’s what we are trying to do when we speculate about which direction the market is going in the short run.
So what adjustments are prudent during election years, if any?
- Long-term investment strategies such as ‘buy-and-hold’ tend to yield better results, as the short-run is incredibly unpredictable, and markets tend to reward patience and consistency
- Maintaining a healthy asset allocation helps create a portfolio that has the ability to withstand various market conditions, including those presented by political shifts
- And diversification helps mitigate risks associated with sector-specific volatility and offers exposure to potential opportunities across different market segments
Beyond politics and economics though, are the emotions and psychology that exist around all of this.
Whether we know it or not, we are impacted by our emotions and our biases. We have limits to our self-discipline, and sometimes the heart overwhelms the mind. We all have the potential to fall victim to our emotions. And those emotions can manifest in several different ways.
So what are some of the common emotional pitfalls to avoid?
- Herd Behavior: Investors who are swayed by their emotions have the tendency to follow the crowd, buying or selling stocks based on perceived trends rather than sticking to a long term buy and hold plan. This can be even more prevalent during election years or other periods of political polarization.
- Overconfidence: Some investors may overestimate their ability to predict market movements based on various outcomes, (Especially revolving around politics) leading to risky investment decisions.
- Loss Aversion: The fear of losses can cause investors to make conservative choices, pulling back investments during times of uncertainty. This can result in missed opportunities when someone gets the timing wrong either on the exit or the re-entry or both. (It’s a lot easier to be wrong than right when attempting to time the market)
Recognizing these behavioral tendencies and admitting our own biases is the first step to correcting them.
Conclusion
It’s tempting to adjust our investment strategy during an election year, especially with the flurry of articles suggesting strategies tied to potential election outcomes. But there are simply too many moving parts in the markets for any single factor, even a presidential election, to accurately predict near-term trends.
We have to remember that ‘The Market’ is made up of people just like you and me. And the events of the world impact us psychologically and emotionally, even if we don’t realize it. In a stock market election year, these factors are amplified.
Investors can become more sensitive to developments related to the elections, leading to increased angst. (How many headlines have you seen claiming – “If this happens, this will be the outcome”.) Often those claims are exaggerated and speculative, even if the writer and many of the readers don’t realize it. There are many variables at play, and even a well-thought out and a well-researched opinion does not guarantee a specific outcome will occur.
In summary, navigating a stock market election year requires understanding the broader economic context, recognizing behavioral finance dynamics, and maintaining a long-term investment perspective. By focusing on these aspects, investors can make informed decisions and work to build portfolios meant to withstand uncertainties, regardless of what’s happening this year in Washington DC or anywhere else.
The information presented in this blog is the opinion of the author and does not reflect the view of any other person or entity. The information provided is believed to be from reliable sources, but no liability is accepted for any inaccuracies. This is for information purposes and should not be construed as an investment recommendation, tax, or legal advice. Past performance is no guarantee of future performance.

