“People are not disturbed by things, but by the view they take of them.”
-Epictetus Tweet
As a kid I was scared of the dark. What was I afraid of? I don’t remember. Probably some monster from a TV show.
I would ask my mom to walk with me to the bathroom to turn on the light. Seeing clearly what was there made me feel safer.
Over time, after seeing that what was there in the light, is the same as what was in the dark, my trust grew to be able to turn on the light on my own.
When we don’t know what to expect, that can feel like we are in the dark. All we see are monsters.
This is when we can use history and others as a guide to shine the light for us.
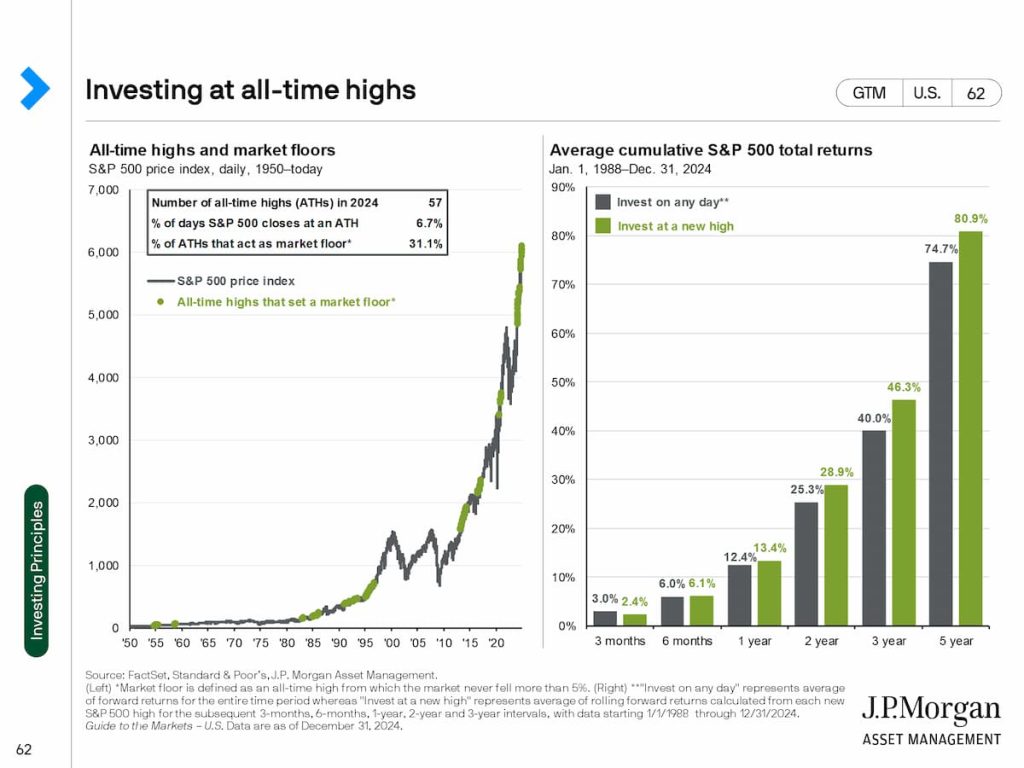
Here is a little light on investing at all time highs…

From time to time, when we turn the light on, we may see a bug. That can be a little scary especially for my wife. She has a distinct scream when she sees one.
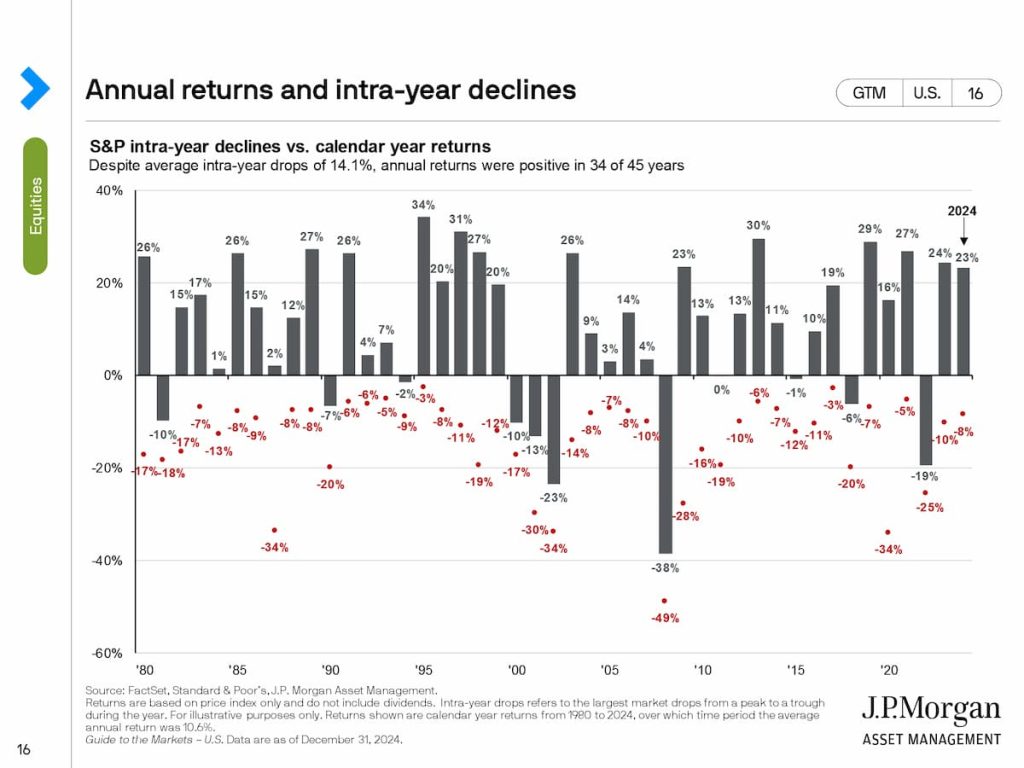
Investing is no different. Sometime stocks go down. You can see that during the calendar year many times there is a drawdown. The average downturn is a little over 14% down. However, the market is up on average 3 out of 4 years.

On the lighter side
Life if made up of meaningful moments. I started a Google Sheet with the date on the left and 1 to 3 sentences on the right of meaningful moments of that day. What this process has done for me, is notice more. To look for nuggets of beauty throughout the day.
Elliott has been home for 3 weeks. That has been wonderful. We took him out for a big steak before he left. He is getting deep into his Finance and Risk Management major. He is going to be taking 3 finance classes this semester.
[1] Source: FactSet, Standard & Poor’s, J.P. Morgan Asset Management.
(Left) *Market floor is defined as an all-time high from which the market never fell more than 5%. (Right) **”Invest on any day” represents average of forward returns for the entire time period whereas “Invest at a new high” represents average of rolling forward returns calculated from each new S&P 500 high for the subsequent 3-months, 6-months, 1-year, 2-year and 3-year intervals, with data starting 1/1/1988 through 12/31/2024.
Guide to the Markets – U.S. Data are as of December 31, 2024.
2 Source: FactSet, Standard & Poor’s, J.P. Morgan Asset Management.
Returns are based on price index only and do not include dividends. Intra-year drops refers to the largest market drops from a peak to a trough during the year. For illustrative purposes only. Returns shown are calendar year returns from 1980 to 2024, over which time period the average annual return was 10.6%.
Guide to the Markets – U.S. Data are as of December 31, 2024.


