Does Congressional Control Affect the Stock Market?
As many of you now know, Congress has flipped from Republican control to Democratic control.
Many people are asking: What does this mean for my retirement money?
Let’s look at what actually happened to stocks over the last 100 years in election years.
Quick Answer:
Which party controls Congress has not been a reliable guide to stock returns. From 1926 through 2025, US stocks trended higher under Republican control, Democratic control, and split control, according to Dimensional Fund Advisors. Since 1874, the S&P 500 has risen in the 12 months after 32 of 38 midterm elections. For retirees, the better move is to stick with a plan built for any outcome.
What does nearly 100 years of market data tell us?
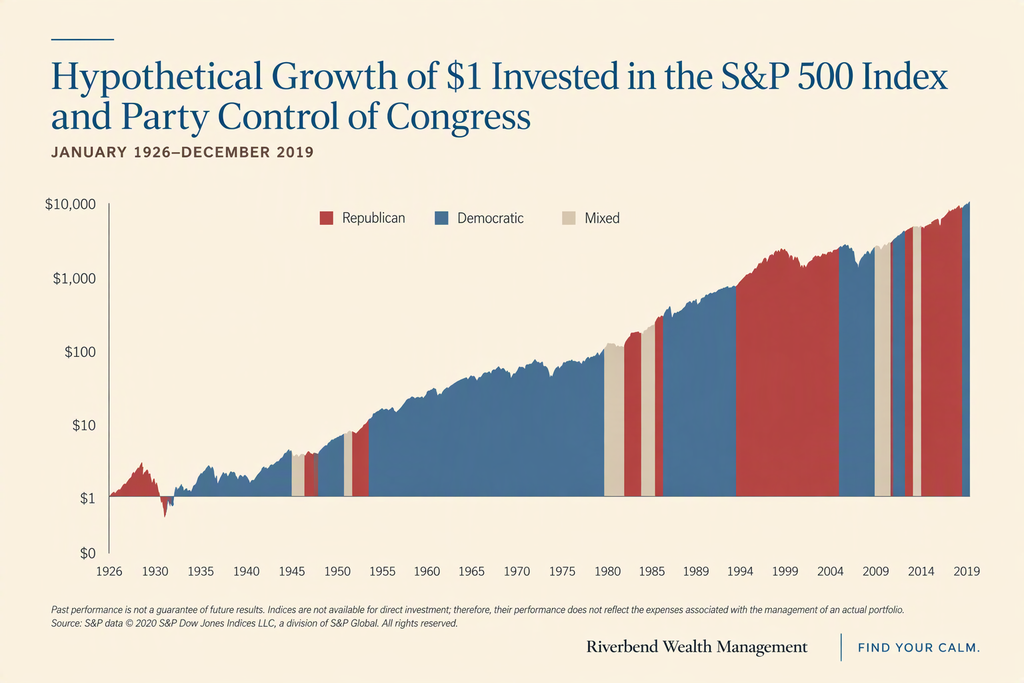
Dimensional Fund Advisors tracked a hypothetical $1 invested in the S&P 500 from 1926 through 2019. Then they shaded each stretch of time by who controlled Congress. Republican House and Senate. Democratic House and Senate. Or mixed control.
The result?
Stocks trended higher under Republicans. They trended higher under Democrats. And they trended higher when the two parties split power.
That dollar continued growing by double digit percentages on average per year in all 3 environments.
Dimensional found the same pattern when they looked at the White House. Stocks rose through Democratic and Republican presidencies alike.
So how much does politics matter for markets?
Laws on taxes, trade, and spending all influence the economy and the investing climate, but those things don’t fully stifle all economic activity. Companies still want to earn, innovate, and grow. Those efforts sometimes need to evolve when the climate changes, but they don’t stop altogether.
How have stocks done after past midterm elections?
Interestingly, the year after a midterm has often been a good one for stocks.
A ‘Motley Fool’ analysis of Robert Shiller’s long-term market data found the S&P 500 rose in the 12 months after 32 of the 38 midterms since 1874. That’s about 84% of the time. The average gain was around 14%, compared with about 11% for any 12-month period.
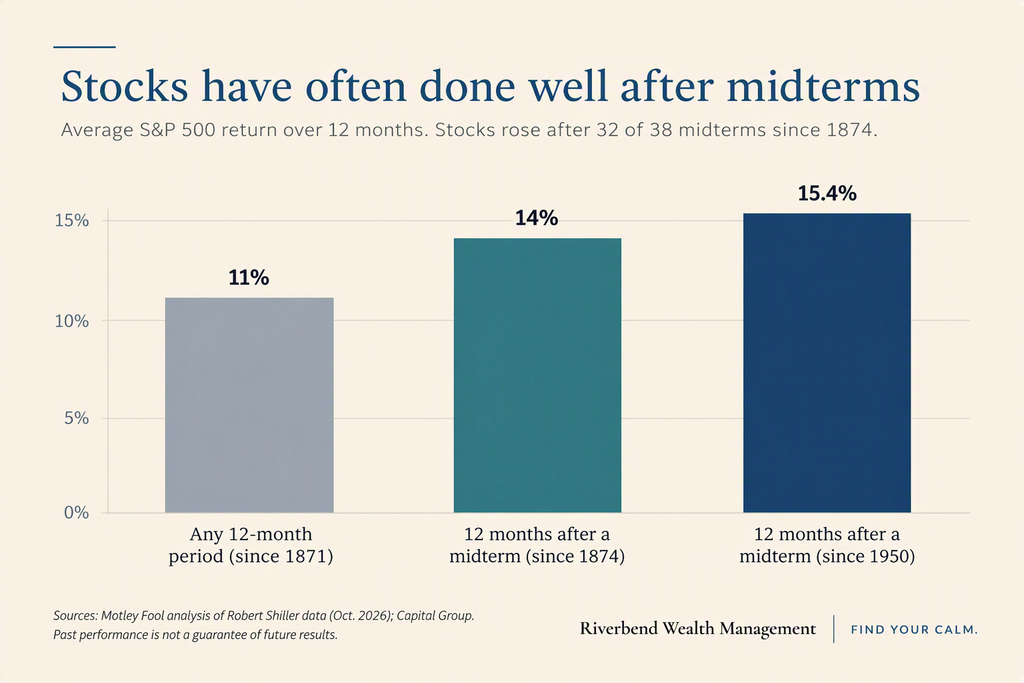
Capital Group ran a similar study starting in 1950. (A shorter timeframe but much more recent than the prior study.) They found the average one-year return after a midterm was about 15.4%.
Why the pattern? One common explanation is simple. Markets dislike uncertainty. Before a midterm, nobody knows who will win or what policies will follow. Once votes are counted, some of that fog lifts. And months later, the clarity is even higher.
Now, a word of caution. There are no guarantees that a past pattern holds up in the future. The long-term data is showing us a tendency, not a promise.
Is divided government good or bad for the stock market?
You’ll hear people say markets love gridlock. The idea is that when neither party has full control, fewer big laws get passed. That generally means less major changes to the way the economy is being managed, so businesses can plan with more confidence.
There’s some support for this. The same ‘Motley Fool’ review we mentioned earlier found that divided government has, on average, been followed by stronger returns than unified government in the year after a midterm.
Again, we don’t know if this outcome will be the same as the past, but sometimes the past is one of the better indicators to look to.
Real financial planning for real life.
Riverbend is a fee-only, fiduciary advisor. Our plans are personal, shaped by your values and designed to help you build a full life.
Who We AreShould I change my investments after the midterms?
For most retirees and pre-retirees, our recommendation is to not make any substantial changes unless there is a personal need to do so.
IF you did decide to make a change, it might be harder than you think to navigate that well.
You’d have to guess which laws will pass. Then you’d have to guess how markets will react. Then you’d have to guess when to get back in. Most of the instances where I’ve seen people try to accomplish that have not ended in their favor.
Dimensional’s data shows how costly being out of the market can be. A hypothetical $1,000 invested in the Russell 3000 at the start of 2001 grew to $8,360 by the end of 2025. If someone in that situation decided to ‘get out’ of the markets for a period of time, and they happened to pick the wrong time, it can be extremely costly.
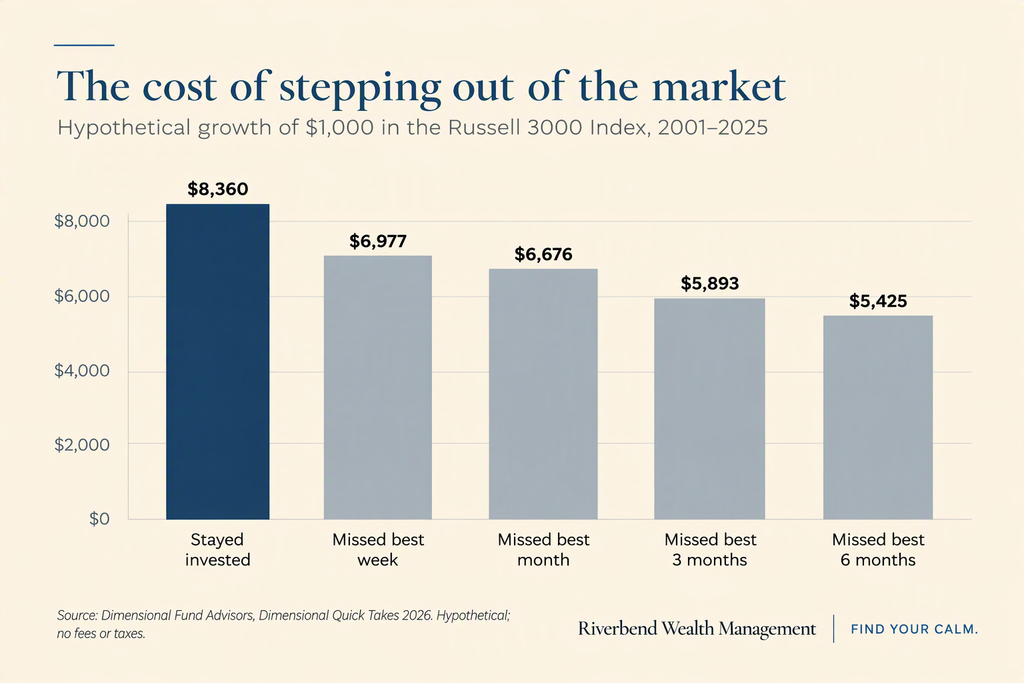
It’s a bit ironic, but some of the best weeks actually happen during downturns, and periods of high volatility.
So instead of an immediate reaction to the news or the headlines, we’ve got a simple framework to start with:
- Do I have enough safe money set aside? Some folks are fine with 3 month’s worth of life spending in this category. Others prefer 3 year’s worth. Somewhere in the middle of that range is probably fine for most folks. This is your cash cushion. It’s there to serve as your short-term income regardless of what happens in the markets.
- Is my portfolio mix still right for my age and goals? It’s wise to revisit this mix from time to time and to make sure it matches your comfort level. And this decision goes beyond the mix between Equities & Fixed Income. There are several layers to proper diversification.
- Are my withdrawal plans sustainable? Your portfolio will serve as your source of income for 20+ years in retirement. You ideally don’t want to draw it down too fast, but you also want it to support your lifestyle without stressing about it. You’ll want to know what your sustainable withdrawal rate is, and you’ll want to ‘stress-test’ the sustainability of that plan in case the unexpected occurs.
- Could new tax laws change my plan? If Congress changes tax rules, that can affect a lot of the decisions you make with your accounts. Certain decisions that have consequences or benefits have the potential to shift dramatically when the rules change.
What should retirees focus on instead of politics?
Focus on what you can control. Your spending. Your taxes. Your mix of investments. Your overall plan.
A good plan is designed to go the distance, regardless of what’s happening in DC.